
As Technical Product Manager, I get a lot of user feedback, both positive and negative. In recent months many people have complained about the Home dashboard. It went something like this:
“Hey, the Home page is useless! We have several hundred services monitored by a single Percona Monitoring and Management (PMM), so this list of metrics is not providing any value when I have this many servers”.
We were happy to note that people were using PMM for big deployments, and we decided to create new types of dashboards for these users. I will provide their description below. But what exactly is the problem with the Home dashboard now? Let’s take a look.
Percona Monitoring and Management Dashboard

The red box represents the visible part of the screen on my laptop. So to see any data, I need to scroll to the bottom of the page. But even if I do, I will see a set of small graphs not related to one another.
If I have more than three nodes, I get something like the example below: (https://pmmdemo.percona.com/)
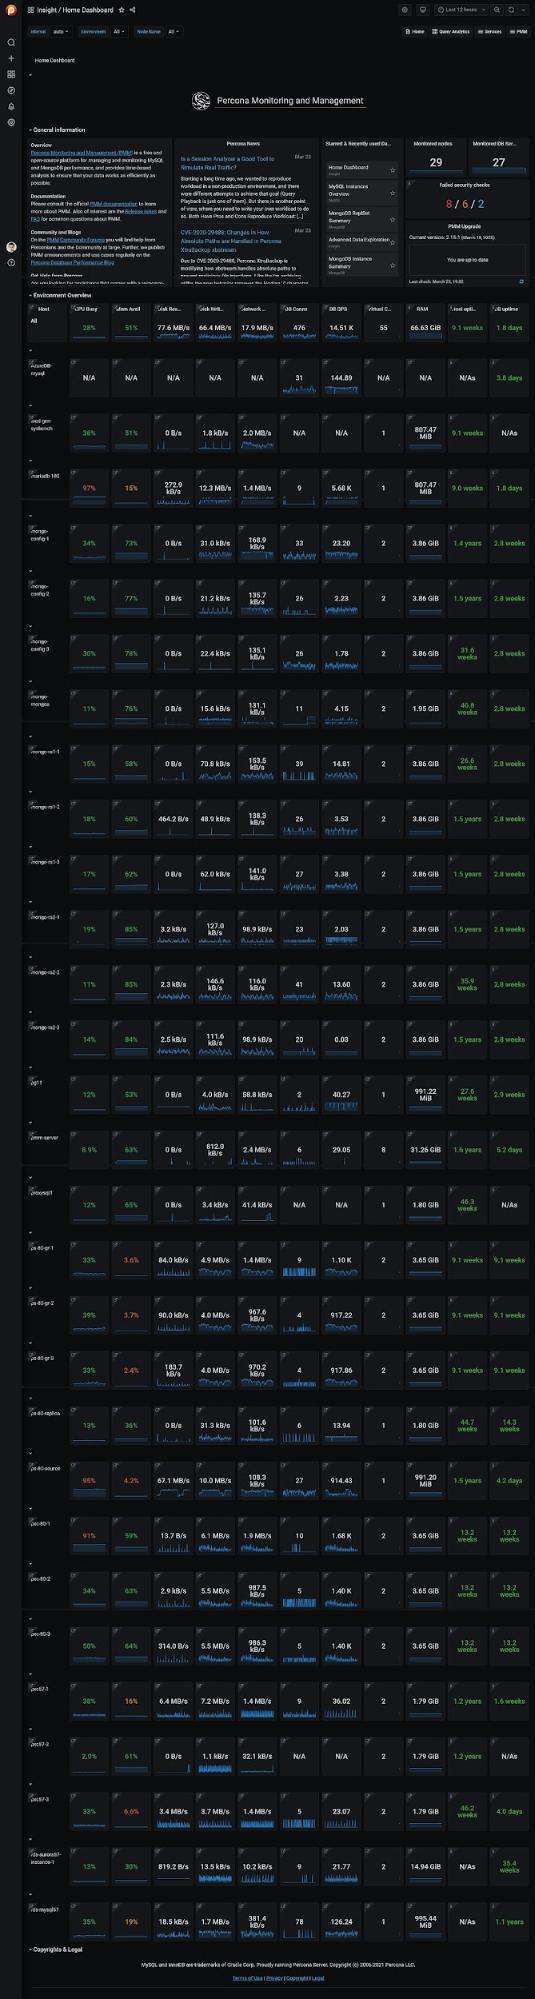
Remember, on the laptop screen, you can only see this much:

You can’t see the complete picture and compare the performance of individual servers; there is nothing actionable.
This dashboard is clearly not meeting the goal of giving the user a high-level overview of their infrastructure. To achieve this goal, we have created two new experimental dashboards – Environment Overview and Environment Summary.
The Environment label is already present in the current version of the dashboard. It lets users specify different groups of the Service. We have the particular flag to add an environment label when you add a Service to PMM.
# pmm-admin add mongodb … --environment=environment1 ..
Here are some ideas of what you can use as an environment:
- “production”, “development”, “testing”
- “departmentA”, “departmentB”, “subDepartmentC”
- “Datacenter1”, “datacenter2”, “cloud-region-east2”
- <Your ideas here>
Setting the environment for your services will simplify the search/selection on all dashboards. The new dashboards let you group your nodes by their environment label.
Environment Overview Dashboard
The Environment Overview Dashboard is designed to be a possible replacement for the default Home dashboard. This dashboard aims to give the user a high-level view of all Environments and how they are behaving.
This dashboard presents the main parameters of all environments. It shows six graphs – three for Node metrics (CPU, Memory, Disk) per environment and three for Services metrics (Used Connections, QPS, Latency) per environment. The Service metrics are inspired by RED Method for MySQL Performance Analyses – Percona Database Performance Blog.
You get some valuable data on the first screen. It provides you a summary of the parameters of your environments and highlights apparent problems. The second screen shows the relationships between the main metrics and how they’ve changed over a selected period of time and allows you to click on graphs and drill down for more detailed information. This will help you spot the environments where you might have a problem and know where to dig deeper to investigate it.


Environment Summary Dashboard
The Environment Summary Dashboard is designed to give you information about one specific Environment and an overview of the activities and behaviors of the Services and Nodes inside that particular environment.

You can also drill down to the specific Services, Nodes, and their parameters for more details from this dashboard. This will help you see the unhealthy Service or Node.

How to Install Dashboards
- Get dashboards:
- Import dashboards to PMM2 https://grafana.com/docs/grafana/latest/dashboards/export-import/
What’s Next?
These two experimental dashboards are not yet ready to be a part of the standard PMM release, but we would LOVE to make them the default. We would appreciate your feedback on making them not just a step forward from the current home dashboard but a HUGE step forward.
If you have many servers, please test the dashboards and let us know if these dashboards provide better visibility over your infrastructure. If not, we would love to hear what sort of data you want to see in these dashboards to speed up decision-making.
You can leave your feedback on our Percona Community Forum. Please help us make Percona Monitoring and Management more useful!
Percona Monitoring and Management is a best-of-breed open source database monitoring solution. It helps you reduce complexity, optimize performance, and improve the security of your business-critical database environments, no matter where they are located or deployed.